Stocks
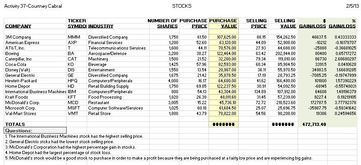
- Describe what you had to do in the assignment?
In this assignment I had to use Microsoft Excel to create a spreadsheet illustrating the losses and gains of the stock market. - Describe what technology skills you had to use to complete the assignment.
I used my formatting skills as well as my skills with excel formulas to complete the assignment clearly and quickly. - Describe what you used and accomplished by creating this piece of work.
I used my formatting and formula skills, further refining them and making them easier to use by completing this piece of work. - Explain what you did well in this assignment.
I feel that I did everything I was supposed to do in this piece of work, I properly used my formulas and the spreadsheet was formatted the way I was asked too in the worksheet. - Explain what you would do differently to improve your work in this assignment.
To improve my work in this assignment, I might have further formatted it to customize it and perhaps make it a little easier to read and understand the bigger numbers.
Formula Features
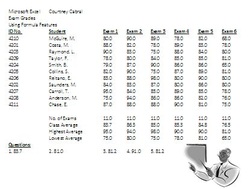
- Describe what you had to do in the assignment?
In this assignment I had to use Microsoft Excel to create a spreadsheet of student's exam scores. - Describe what technology skills you had to use to complete the assignment.
I used my skills with excel formulas to complete the assignment. - Describe what you used and accomplished by creating this piece of work.
I used formula skills to gain a further understanding of them. - Explain what you did well in this assignment.
I feel that I did everything I was supposed to do in this piece of work, I used my formulas and the spreadsheet was formatted the way I was asked too in the worksheet. Everything is clearly labeled and easy to use and follow. - Explain what you would do differently to improve your work in this assignment.
To improve my work in this assignment, I would have formatted it to customize it.
Microsoft Excel Column Charts Project
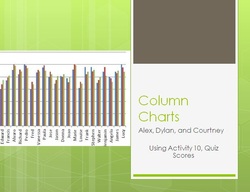
- Describe what you had to do in the assignment?
In this assignment, we were assigned a specific type of chart to research and teach the class how to make the chart in excel. We created a PowerPoint assignment explaining how to create the chart, as well as an assignment for a class to practice making the charts. We also did a demo for the class on how to create the chart. - Describe what technology skills you had to use to complete the assignment.
To complete this assignment I had to utilize my skills in PowerPoint to create a clear and concise presentation for the class to follow along with. I had to take screenshots of my explanations so that my peers would know what I was doing, and I had to decorate the PowerPoint to fit my needs including layout and color schemes. - Describe what you used and accomplished by creating this piece of work.
In this assignment I accomplished doing a presentation, which is not my strongest point. I feel that we were organized and well prepared and that the presentation came across clearly and without error. - Explain what you did well in this assignment.
I feel like I organized this assignment very well. My peers followed along and caught onto the assignment quickly with little or no problems in doing so. It was simple, without unnecessary information, and it got the point across to my peers. - Explain what you would do differently to improve your work in this assignment.
In order to improve the work in this assignment, I would have liked a different group. I feel that certain members didn't contribute and as a result could have brought down our presentation as well as deprive us of their insight and ideas. Personally I think that my portion of the assignment (the PowerPoint) came out very well. However, I would have liked to add even more screenshots to the presentation.
Yacht Mortgage Calculator
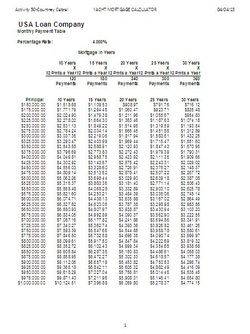
Responses will be updated!
